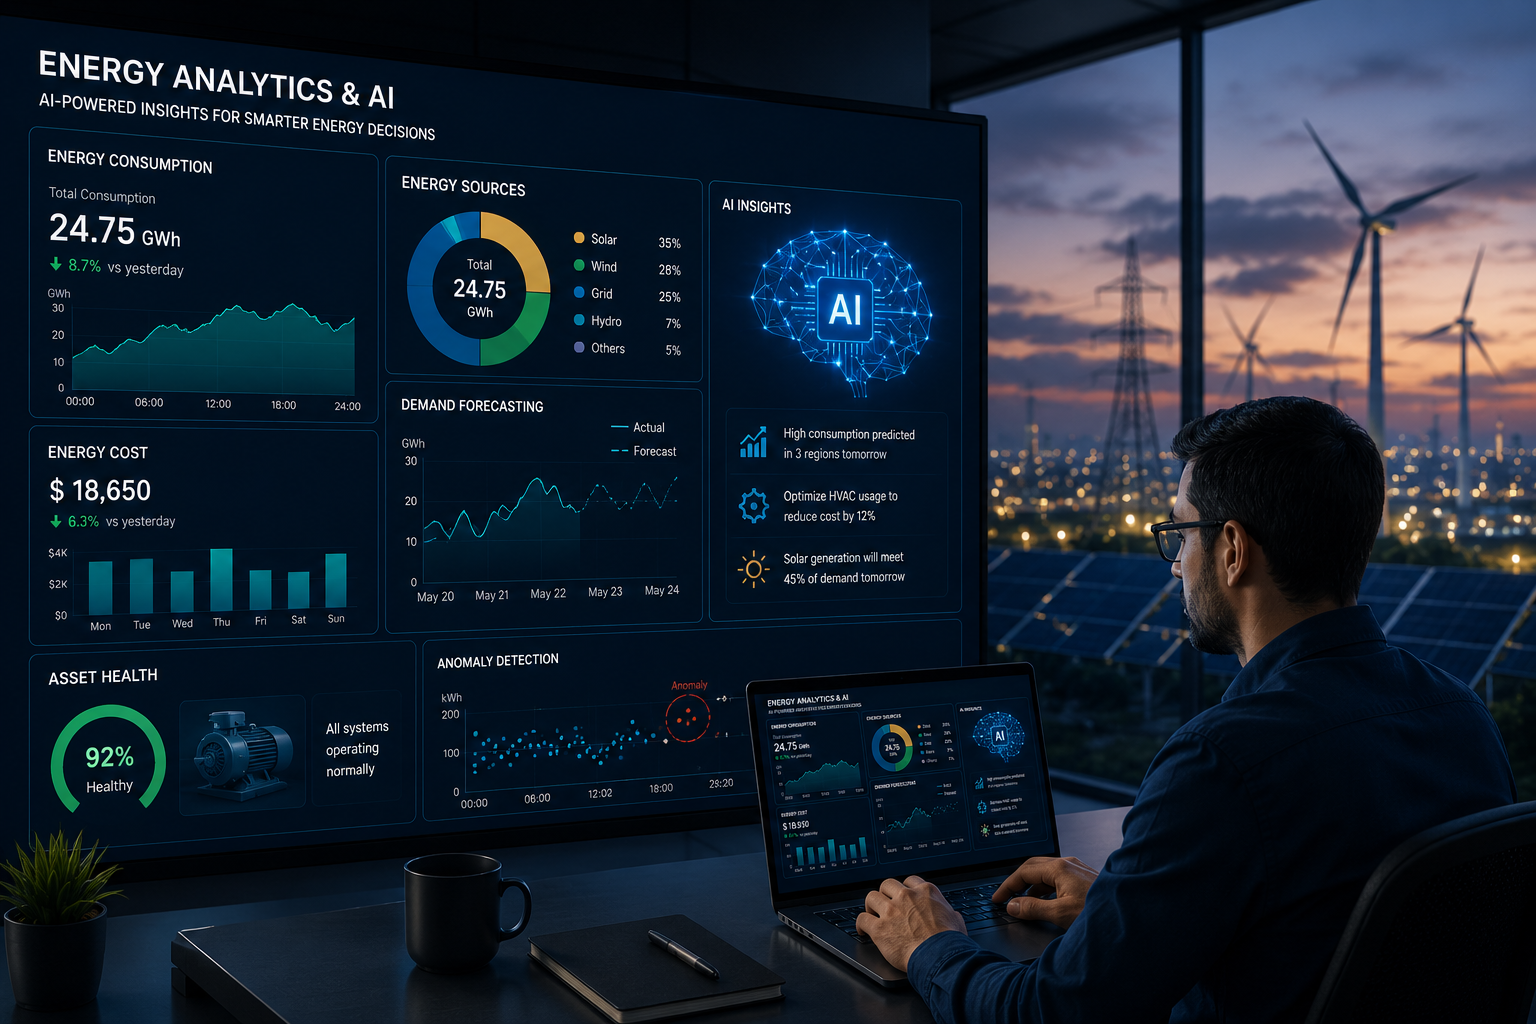
Generation & Demand Forecasting
Weather- and behaviour-driven models predict output and load hours to days ahead.
Pixous Energy
Machine-learning that forecasts generation and demand, flags anomalies before they cost you, and continuously optimises dispatch across every asset — all inside Grid OS.

Pixous Energy unifies telemetry from solar, wind, storage, EV charging and the grid into a single time-series model — so every forecast, alert and optimisation runs on the same trusted data.
AI models learn from your own operations, improving forecasts, catching anomalies early and dispatching assets against price, demand and carbon in real time.
Weather- and behaviour-driven models predict output and load hours to days ahead.
Spot drift, faults and losses the moment they appear, with alerts routed to whoever can act.
Automatically balance generation, storage and demand against price and carbon.
Live virtual models of every asset for simulation, testing and what-if planning.
Audit-ready energy, cost and carbon reporting generated straight from meter data.
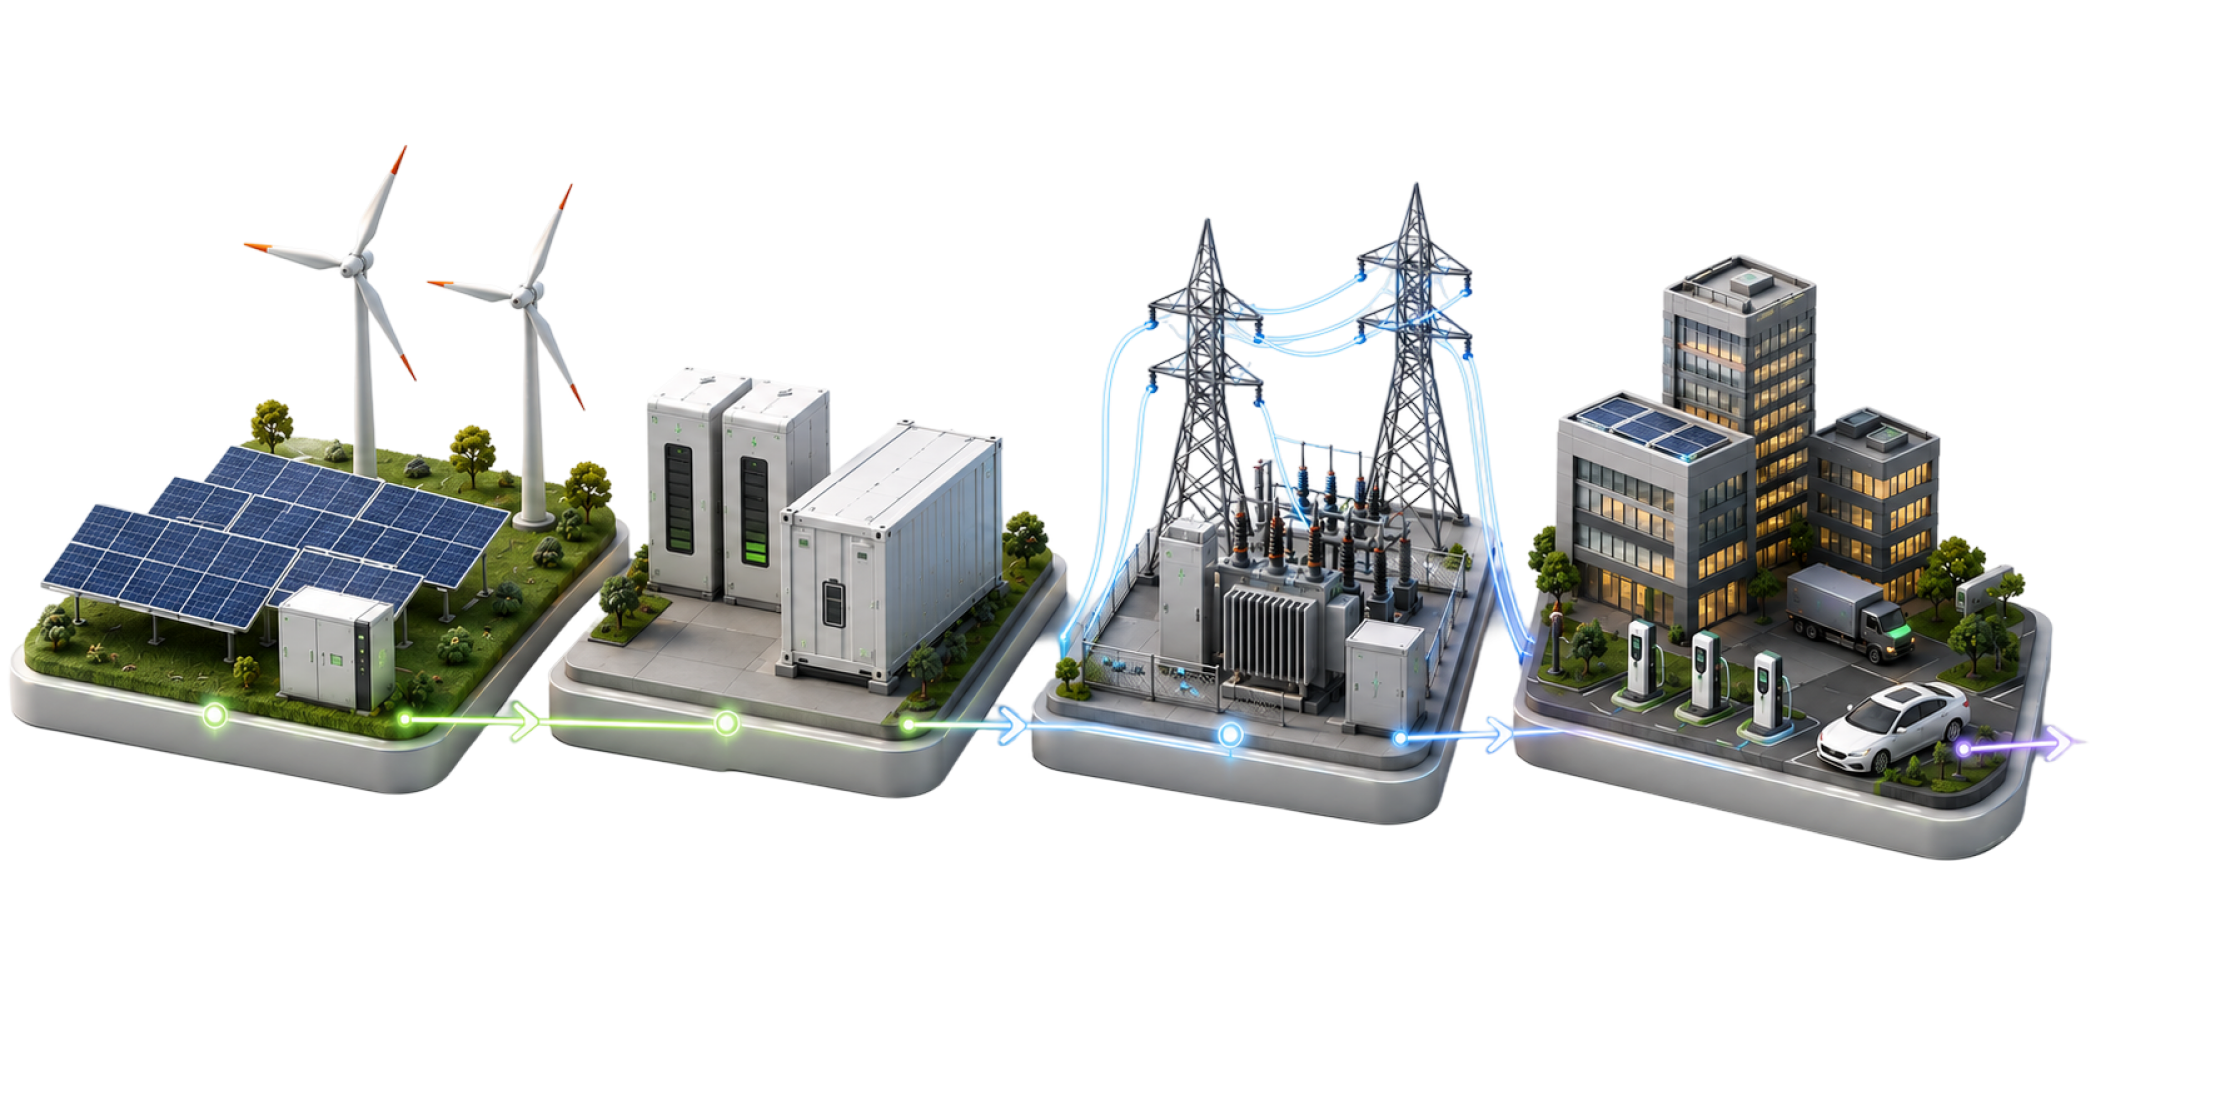
Stream telemetry from every asset into one unified time-series model.
Train forecasting, anomaly and optimisation models on your own data.
Push recommendations and automated actions straight into operations.
Turn results into commercial, carbon and ESG insight.
Forecasting, anomaly and optimisation models tuned per asset class.
Physics- and data-driven twins for simulation and planning.
Portfolio-to-asset views of performance, cost and carbon.
One data and control layer across every connected asset.
Bring us one site or one thousand. We'll model the outcome, agree the guarantees, and have your first assets streaming into Grid OS within a quarter.